
OFFICE NO 5 & 6, 3RD FLOOR,
EARTH ALPHA COMPLEX
VASNA BHAYLI RD, VADODARA
GUJARAT, INDIA

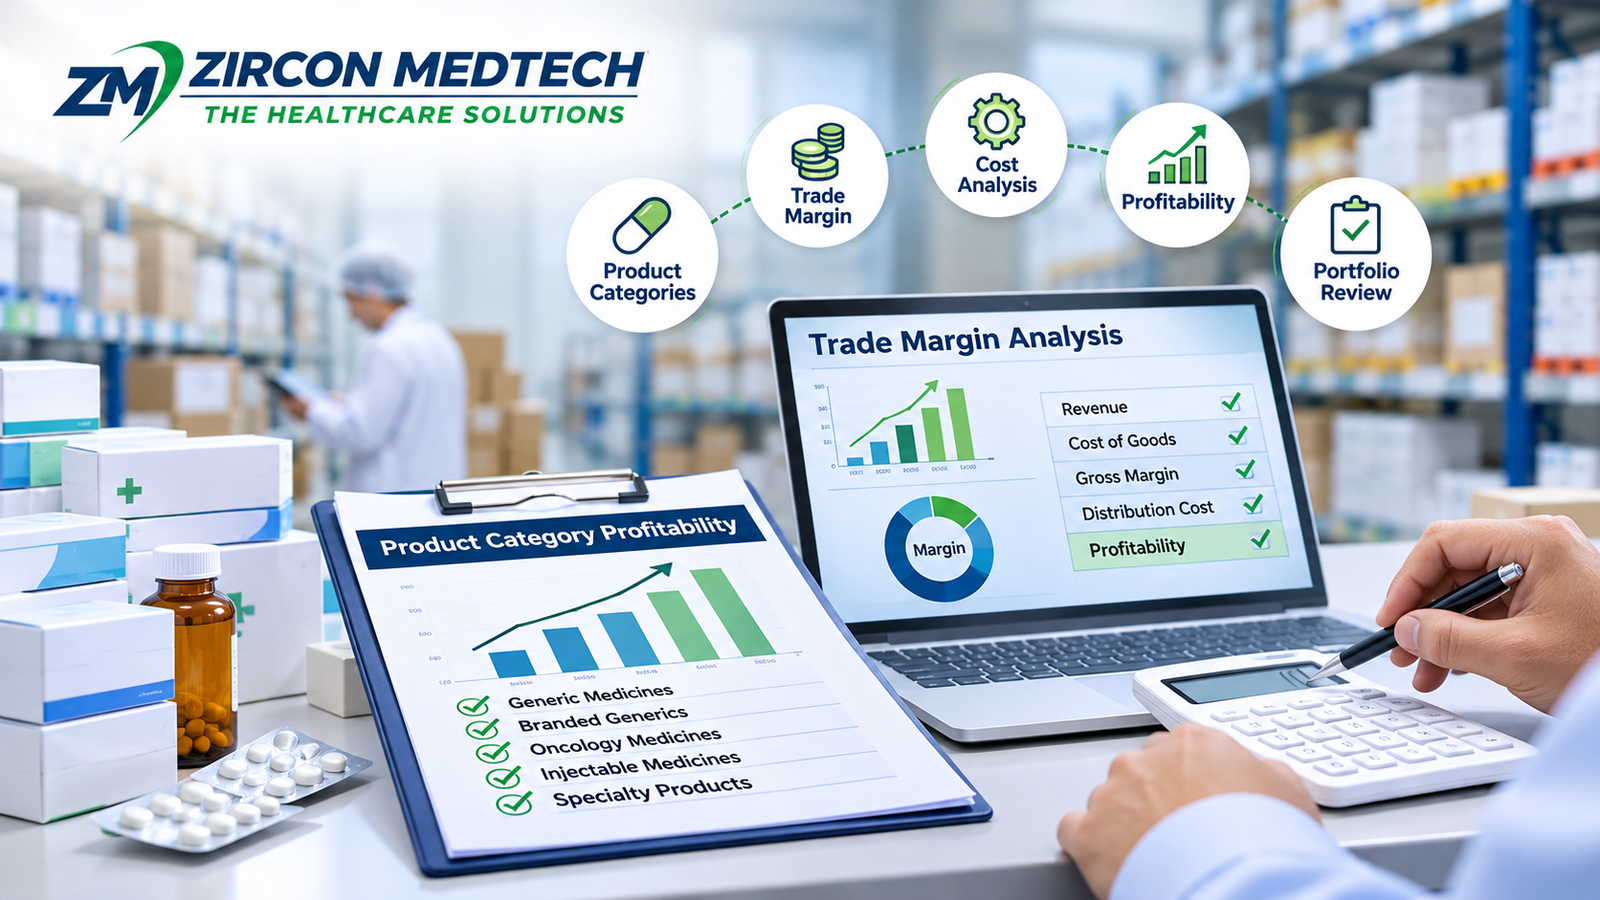
What Is Trade Margin Rationalisation in Pharmaceutical Distribution?
Trade margin rationalisation is the process of reviewing and adjusting pharmaceutical product margins to improve profitability while maintaining commercially sustainable pricing and distribution arrangements.
It involves evaluating the relationship between procurement costs, selling prices, operational expenses, product demand and inventory risks.
For example, a distributor may earn a higher gross margin percentage on a specialised medicine than on a commonly prescribed generic product. However, the specialised medicine may require additional storage, regulatory handling or inventory financing.
The distributor should therefore compare both the gross margin and the actual contribution remaining after relevant costs.
Common Reasons to Review Pharmaceutical Trade Margins
Why Should Pharmaceutical Distributors Evaluate Profitability Across Product Categories?
Pharmaceutical distributors often manage products with different commercial characteristics. A single margin target may not reflect the actual costs and risks associated with each category.
Generic medicines may operate in competitive markets where pricing pressure is significant. Specialised medicines may have different purchasing conditions, demand volumes and storage requirements.
A category-level profitability review helps distributors understand which products generate sustainable financial returns and which require closer commercial attention.
A Profitability Review Should Establish
Identify the Pharmaceutical Product Categories in Your Portfolio
Begin by grouping pharmaceutical products into categories that reflect the distributor's actual commercial operations.
The categories should be sufficiently detailed to highlight meaningful differences in pricing, handling requirements and customer demand.
Product Categories to Consider
|
Product Category |
Key Commercial Considerations |
|
Generic medicines |
Competitive pricing, purchasing volumes and inventory turnover |
|
Branded generic medicines |
Brand positioning, procurement pricing and customer demand |
|
Oncology medicines |
Product-specific demand, expiry exposure and handling requirements |
|
Injectable medicines |
Packaging, transport conditions and storage requirements |
|
Chronic therapy medicines |
Replenishment frequency, demand consistency and stock availability |
|
Specialty pharmaceuticals |
Product-specific logistics, regulatory obligations and financing costs |
A distributor may need to divide these categories further by manufacturer, dosage form, therapeutic segment or destination market.
The objective is to compare products with similar commercial characteristics rather than combining unrelated items into one profitability calculation.
Calculate Gross Margin for Each Pharmaceutical Product Category
Gross margin is an initial measure of pharmaceutical distribution profitability.
It shows the percentage of sales revenue remaining after deducting the cost of goods sold.
Gross Margin (%) = [(Net Sales Revenue − Cost of Goods Sold) ÷ Net Sales Revenue] × 100
For consistent comparisons, net sales revenue should account for relevant discounts, returns and credits. The cost of goods sold should follow the distributor's accounting policy, including applicable directly attributable inventory costs.
Hypothetical Example of Category-Level Gross Margins
|
Product Category |
Net Sales Revenue |
Cost of Goods Sold |
Gross Margin |
|
Generic medicines |
$100,000 |
$82,000 |
18% |
|
Branded generics |
$80,000 |
$62,400 |
22% |
|
Oncology medicines |
$60,000 |
$49,200 |
18% |
|
Injectable medicines |
$50,000 |
$41,000 |
18% |
These figures are hypothetical and are provided only to demonstrate the calculation. They do not represent actual pharmaceutical industry margins.
Although branded generics show the highest gross margin percentage in this example, the distributor still needs to review logistics, financing and inventory costs before determining which category delivers the strongest overall contribution.
Evaluate the Full Cost of Pharmaceutical Distribution
Gross margin alone does not explain the total financial performance of a pharmaceutical product.
Distributors should identify additional expenses that are relevant to each product category and determine whether those costs are already included in the cost of goods sold.
Avoid counting the same expense twice when calculating profitability.
Costs to Review Across Product Categories
Where costs are shared across several categories, distributors should apply a consistent allocation method and document the assumptions used.
Compare Gross Margin With Contribution Margin
Contribution margin provides another perspective on pharmaceutical product profitability.
It measures the revenue remaining after deducting the costs classified as variable for the analysis.
Contribution Margin = Net Sales Revenue − Variable Costs
The calculation should include the cost of goods sold and any additional variable distribution expenses that have not already been included.
Hypothetical Example of a Contribution Margin Review
|
Financial Measure |
Generic Medicines |
Injectable Medicines |
|
Net sales revenue |
$100,000 |
$100,000 |
|
Cost of goods sold |
$82,000 |
$80,000 |
|
Gross profit |
$18,000 |
$20,000 |
|
Additional variable distribution costs |
$4,000 |
$8,000 |
|
Contribution margin |
$14,000 |
$12,000 |
|
Contribution margin percentage |
14% |
12% |
In this example, injectable medicines have a higher gross margin but a lower contribution margin because of additional variable distribution costs.
The comparison demonstrates why pharmaceutical distributors should not evaluate category profitability using selling prices and purchasing costs alone.
Review Inventory Turnover and Working Capital Requirements
Inventory turnover can influence the financial performance of pharmaceutical distribution businesses.
Products that remain in storage for extended periods may increase financing expenses and create additional exposure to expiry-related losses.
A product with a relatively modest margin may still contribute positively when demand is consistent and inventory moves efficiently.
Questions to Ask During an Inventory Review
Distributors can also calculate inventory turnover using the cost of goods sold divided by average inventory value, provided the values are measured consistently.
Assess the Impact of Discounts and Customer Pricing
Customer discounts can significantly affect pharmaceutical trade margins.
A distributor may negotiate attractive procurement prices but lose part of the expected margin through customer rebates, volume discounts, promotional allowances or extended payment terms.
Review pricing arrangements alongside the actual costs of serving each customer group.
Pricing Factors to Evaluate
For example, two customers purchasing the same medicine may generate different contribution margins if one requires frequent small deliveries and extended payment terms.
Evaluate Pharmaceutical Sourcing Costs and Supplier Terms
Supplier arrangements can influence the profitability of different medicine categories.
Distributors should compare more than the quoted product price when evaluating sourcing opportunities.
Order quantities, payment terms, lead times, packaging configurations and delivery arrangements may affect the total cost of procurement.
Supplier Information to Review
When reviewing sourcing options with Zircon Medtech, distributors can provide product-specific requirements and expected purchasing volumes to support discussions about available products and commercial terms.
Understand How Product Expiry Risk Affects Profitability
Expiry-related losses can reduce the profitability of pharmaceutical distribution categories.
Medicines with limited remaining shelf life, unpredictable demand or longer procurement cycles may create additional financial exposure.
A higher purchase volume may reduce the unit acquisition price, but it can also increase the amount of stock at risk if sales do not meet expectations.
Checks Before Placing a Purchase Order
Product quality and regulatory requirements must remain mandatory conditions of supply, regardless of the potential financial return.
Develop a Product Category Profitability Scorecard
A profitability scorecard allows distributors to review financial and operational performance using a consistent set of indicators.
The scorecard can be updated monthly or quarterly depending on sales volume, inventory movement and management reporting requirements.
Suggested Pharmaceutical Profitability Scorecard
|
Performance Indicator |
What to Measure |
|
Net sales revenue |
Revenue after applicable discounts, returns and credits |
|
Gross margin percentage |
Gross profit relative to net sales |
|
Contribution margin |
Revenue remaining after relevant variable costs |
|
Inventory turnover |
Speed at which inventory is sold or used |
|
Inventory holding period |
Average time products remain in stock |
|
Expiry-related losses |
Value of stock written off due to expiry |
|
Logistics cost |
Transport and handling expenses by category |
|
Customer payment period |
Time taken to collect customer payments |
|
Supplier lead time |
Time required to replenish inventory |
The scorecard should use consistent reporting periods and accounting assumptions so category comparisons remain meaningful.
Hypothetical Example of Trade Margin Rationalisation
An international pharmaceutical distributor manages three product categories: generic medicines, branded generics and injectable medicines.
During a quarterly review, the distributor finds that branded generics generate a relatively strong gross margin, while generic medicines account for a larger share of sales volume.
Injectable medicines also generate meaningful revenue but involve higher handling and distribution expenses.
Rather than applying the same margin adjustment to every product, the distributor reviews each category separately.
How the Distributor Evaluates Its Portfolio
|
Category |
Review Finding |
Possible Commercial Response |
|
Generic medicines |
High sales volume with competitive pricing pressure |
Review purchasing quantities and supplier pricing |
|
Branded generics |
Strong gross margin with moderate inventory turnover |
Compare customer demand with replenishment schedules |
|
Injectable medicines |
Higher handling expenses reduce contribution margin |
Review logistics arrangements and cost allocation |
The distributor then compares the expected financial benefit of each proposed change with its operational and contractual implications.
This approach supports more informed pricing and procurement decisions without assuming that the category with the highest gross margin is automatically the most profitable.
Common Mistakes to Avoid in Pharmaceutical Trade Margin Rationalisation
Comparing Product Categories Using Gross Margin Alone
Include relevant logistics, financing, inventory and customer servicing expenses before evaluating category-level contribution.
Ignoring Slow-Moving Pharmaceutical Inventory
Review inventory turnover, demand forecasts and expiry exposure when assessing profitability.
Applying the Same Margin Target to Every Product
Consider the different commercial and operational characteristics of each medicine category.
Overlooking Customer Discounts and Credit Terms
Calculate profitability using actual realised revenue and relevant financing expenses rather than relying only on standard price lists.
Selecting Suppliers Based Only on Purchase Price
Evaluate supplier reliability, product quality, documentation, lead times and total procurement costs.
Reducing Costs Without Reviewing Compliance Requirements
Do not compromise required storage conditions, product quality, traceability or regulatory obligations to improve reported margins.
Discuss Your Pharmaceutical Sourcing Requirements With Zircon Medtech
Pharmaceutical distributors evaluating profitability across product categories can begin by reviewing their sourcing requirements, purchasing volumes and commercial objectives.
When contacting Zircon Medtech, provide the destination market, required pharmaceutical categories, exact product presentations, expected order quantities and preferred delivery schedules.
Include applicable documentation requirements, storage conditions and minimum remaining shelf-life expectations.
Clear sourcing information can help distributors assess available supply options and compare relevant commercial arrangements as part of a broader profitability review.
Visit Zircon Medtech
Keeping Pharmaceutical Trade Margin Rationalisation Focused
Trade margin rationalisation should be an ongoing process rather than a one-time pricing exercise.
Begin with product categories that account for significant sales, inventory investment or operational expenses. Compare gross margins, contribution margins, inventory turnover and sourcing costs using consistent financial measures.
Review the findings whenever supplier terms, customer pricing, product demand or distribution expenses change.
A structured approach helps pharmaceutical distributors identify opportunities to improve commercial performance while maintaining the quality, compliance and supply reliability required in international pharmaceutical distribution.









Share This News